
Under land 5 miles from Gilroy in The United States, a shallow M4.0 earthquake occurred in the early morning of Wednesday November 26th, 2025. The earthquake struck near a very densely populated region. The USGS has indicated there is a potential risk at tsunami's following this earthquake.
Felt the earthquake? Share this article: 


Earthquake Summary
The earthquake struck on land in The United States, 5 miles (8 km) east of Gilroy in California. The center of this earthquake had a very shallow depth of 2 km. Shallow earthquakes usually have a larger impact than earthquakes deep in the earth.
| Date and Time: | Nov 26, 2025 06:16AM (Los Angeles Time) - Nov 26, 2025 14:16 Universal Time. |
|---|---|
| Location: | 5 mi east of Gilroy, California, The United States. Coordinates 36°59'50"N 121°28'32"W. |
| Map: | 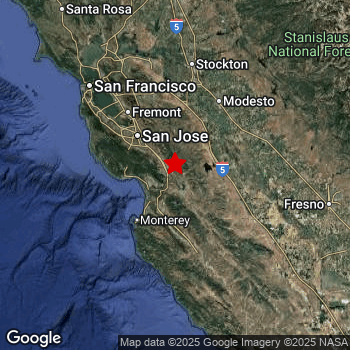 Map of area around epicenter. Click to open in Google Maps. |
| Magnitude: | MAG 4.0 Detected by 17 stations. Maximum Error Range ±0.2 . |
| Depth: | 2 mi (3 km) A very shallow depth. |
| Max. Intensity: | V
Moderate On the Modified Mercalli Scale. |
| Tsunami Risk: | Potential tsunami risk The USGS has indicated there is a potential risk at tsunami's following this earthquake. Always stay cautious - More info here. |
Potential tsunami risk
There is a potential tsunami risk in the aftermath of this earthquake, immediately evacuate to higher grounds away from coastal areas and monitor advice from local authorities. The US Geographic Survey organization has indicated a potential risk for tsunami's following this earthquake.
Tsunami Risk Factors
| Factor | Under Sea? | MAG-6.5 or stronger? | Shallow depth? |
|---|---|---|---|
| Explanation | Almost all tsunami's are caused by earthquakes with their epicenter under sea or very near the sea. However stay cautious in coastal areas as earthquakes on land may cause landslides into sea, potentially still causing a local tsunami. | Under MAG 6.5: Very unlikely to cause a tsunami. MAG 6.5 to 7.5: Destructive tsunami's do occur, but are uncommon. Likely to observe small sea level changes. MAG 7.6+: Earthquakes with these magnitudes might produce destructive tsunami's. |
Most destructive tsunami's are caused by shallow earthquakes with a depth between 0 and 100km under the surface of the earth. Deeper tsunami's are unlikely to displace to ocean floor. |
| This Earthquake | Not this earthquake. This earthquake appears to have struck on land far from any coast. |
Not this earthquake. This earthquake had a magnitude of 4. Earthquakes of this strength are unlikely to trigger a tsunami. |
This earthquake occurred at a depth of of 2 mi (3 km). Earthquakes this shallow could trigger a tsunami. |
Minimal impact predicted
Based on scientific estimates by the US Geographic Survey (USGS), the risk of high fatalities for this earthquake is classified at level GREEN (low). They expect an 65% likelyhood of between 0 and 1 fatalities, and a 96% chance that the number of fatalities falls no higher than 10.
The USGS classifies the economic impact of this earthquake at level GREEN (low). They expect an 65% likelyhood of between 0 and 1 million US Dollars in economic damage and impact, and a 96% chance that the economic impact of this earthquake falls no higher than 10 million USD.
Roughly 8 million people exposed to shaking
This earthquake may have been felt by around 8 million people. That is the expected population size of the area exposed to a level of shaking of II or higher on the Modified Mercalli scale according to the USGS.
The highest earthquake impact level for this earthquake is IV, which corresponds with light shaking and likely no damage. Roughly 57,840 people are expected to be exposed to this level. The majority of people (roughly 7.4 million) live in an area exposed to level II, where very weak shaking and no damage is expected.
| People | MMI Level | Shaking | Damage |
|---|---|---|---|
| 6,285,000 | I |
Not noticable | None |
| 7,447,000 | II |
Very weak | None |
| 960,100 | III |
Weak | Probably none |
| 57,840 | IV |
Light | Likely none |
| 0 | V |
Moderate | Very light |
| 0 | VI |
Strong | Light |
| 0 | VII |
Very Strong | Moderate |
| 0 | VIII |
Severe | Moderate to heavy |
| 0 | IX |
Violent | Heavy |
| 0 | X |
Extreme | Very heavy |
Nearby towns and cities
This earthquake may have been felt in The United States . The closest significant population center near the earthquake is Gilroy in California, The United States. Gilroy is located 5 miles (8 km) east of the epicenter. The intensity of shaking and damage in Gilroy is estimated to be around level IV on the Modified Mercalli Intensity scale (light shaking, likely no damage).
Multiple large cities are in proximity of today's earthquake. San Jose is located 33 mi to the northwest and experienced an intensity of III (weak shaking, probably no damage). San Francisco is located 75 mi to the northwest and experienced an intensity of II (very weak shaking, no damage). Salinas is located 24 mi to the south-southwest and experienced an intensity of II (very weak shaking, no damage).
A complete list of nearby places is included below. Estimated intensity data (MMI) sourced from a shake-map published by the US Geographic Survey is shown where available (cities without data probably experienced little impact).
Overview of nearby places
| Distance | Place | Intensity (MMI) |
|---|---|---|
| 5 mi (8 km) W from epicenter |
Gilroy California, The United States. |
IV
Light |
| 11 mi (17 km) SSE from epicenter |
Hollister California, The United States. |
III
Weak |
| 14 mi (22 km) NW from epicenter |
Morgan Hill California, The United States. |
III
Weak |
| 17 mi (27 km) WSW from epicenter |
Watsonville California, The United States. |
III
Weak |
| 19 mi (30 km) SW from epicenter |
Prunedale California, The United States. |
II
Weak |
| 24 mi (39 km) SSW from epicenter |
Salinas California, The United States. |
II
Weak |
| 28 mi (45 km) W from epicenter |
Live Oak California, The United States. |
II
Weak |
| 28 mi (45 km) SW from epicenter |
Marina California, The United States. |
II
Weak |
| 30 mi (49 km) W from epicenter |
Santa Cruz California, The United States. |
II
Weak |
| 32 mi (51 km) NW from epicenter |
Alum Rock California, The United States. |
II
Weak |
| 32 mi (51 km) WNW from epicenter |
Los Gatos California, The United States. |
III
Weak |
| 33 mi (53 km) NW from epicenter |
Campbell California, The United States. |
III
Weak |
| 33 mi (53 km) NW from epicenter |
San Jose California, The United States. |
III
Weak |
| 34 mi (54 km) SW from epicenter |
Seaside California, The United States. |
II
Weak |
| 35 mi (56 km) E from epicenter |
Los Banos California, The United States. |
II
Weak |
| 35 mi (57 km) WNW from epicenter |
Saratoga California, The United States. |
III
Weak |
| 36 mi (58 km) NW from epicenter |
Santa Clara California, The United States. |
III
Weak |
| 36 mi (58 km) SW from epicenter |
Pacific Grove California, The United States. |
II
Weak |
| 36 mi (58 km) SW from epicenter |
Monterey California, The United States. |
II
Weak |
| 38 mi (61 km) NNE from epicenter |
Patterson California, The United States. |
II
Weak |
| 38 mi (61 km) NW from epicenter |
Cupertino California, The United States. |
II
Weak |
| 38 mi (61 km) NW from epicenter |
Milpitas California, The United States. |
II
Weak |
| 40 mi (65 km) NW from epicenter |
Sunnyvale California, The United States. |
II
Weak |
| 40 mi (65 km) SSE from epicenter |
Soledad California, The United States. |
II
Weak |
| 43 mi (69 km) NW from epicenter |
Mountain View California, The United States. |
II
Weak |
| 44 mi (71 km) NW from epicenter |
Los Altos California, The United States. |
II
Weak |
| 47 mi (76 km) NW from epicenter |
Fremont California, The United States. |
III
Weak |
| 48 mi (77 km) NW from epicenter |
Palo Alto California, The United States. |
II
Weak |
| 48 mi (77 km) NW from epicenter |
Newark California, The United States. |
III
Weak |
| 48 mi (78 km) NE from epicenter |
Turlock California, The United States. |
II
Weak |
| 49 mi (79 km) NW from epicenter |
East Palo Alto California, The United States. |
II
Weak |
| 50 mi (80 km) NNW from epicenter |
Livermore California, The United States. |
II
Weak |
| 50 mi (81 km) NE from epicenter |
Ceres California, The United States. |
II
Weak |
| 50 mi (81 km) NW from epicenter |
Menlo Park California, The United States. |
II
Weak |
| 51 mi (82 km) NW from epicenter |
Union City California, The United States. |
II
Weak |
| 51 mi (82 km) NNW from epicenter |
Pleasanton California, The United States. |
II
Weak |
| 52 mi (83 km) N from epicenter |
Tracy California, The United States. |
II
Weak |
| 52 mi (83 km) NNE from epicenter |
Modesto California, The United States. |
II
Weak |
| 53 mi (86 km) NW from epicenter |
Redwood City California, The United States. |
II
Weak |
| 55 mi (88 km) NNW from epicenter |
Dublin California, The United States. |
II
Weak |
| 57 mi (92 km) NNE from epicenter |
Manteca California, The United States. |
II
Weak |
| 57 mi (92 km) NW from epicenter |
Hayward California, The United States. |
II
Weak |
| 58 mi (94 km) NW from epicenter |
Castro Valley California, The United States. |
II
Weak |
| 58 mi (94 km) ENE from epicenter |
Merced California, The United States. |
I
Not felt |
| 61 mi (98 km) NNW from epicenter |
San Ramon California, The United States. |
II
Weak |
| 61 mi (98 km) NW from epicenter |
San Mateo California, The United States. |
II
Weak |
| 67 mi (108 km) N from epicenter |
Stockton California, The United States. |
I
Not felt |
| 71 mi (114 km) NW from epicenter |
Oakland California, The United States. |
II
Weak |
| 75 mi (120 km) NW from epicenter |
San Francisco California, The United States. |
II
Weak |
| 96 mi (154 km) E from epicenter |
Fresno California, The United States. |
I
Not felt |
| 109 mi (176 km) N from epicenter |
Sacramento California, The United States. |
I
Not felt |
| 176 mi (284 km) NNE from epicenter |
Carson City Nevada, The United States. |
Earthquake Intensity Map
The maximum intensity (MMI Scale) caused by this earthquake is V. The map below shows in which areas this earthquake was the most and least impactful. It is based on data from the US Geographic Survey.

9 Aftershocks detected
This main shock was followed by 9 smaller aftershocks. Just 1 day after this main shock, an earthquake measuring MAG-4 was detected 14 mi (23 km) south-southwest of this earthquake.
In the days before this main shock, 1 smaller foreshock was detected. Roughly 2 days before this earthquake, a foreshock measuring MAG-3.2 was detected nearby this earthquake.
Overview of foreshocks and aftershocks
| Classification | Magnitude | When | Where |
|---|---|---|---|
| Foreshock | M 3.2 |
2 days earlier Nov 23, 2025 11:09PM (Los Angeles Time) | 32 mi (51 km) SSE from Main Shock. |
| Main Shock This Earthquake |
M 4.0 |
Nov 26, 2025 06:16AM (Los Angeles Time) | - |
| Aftershock | M 2.7 |
2 mins later Nov 26, 2025 06:18AM (Los Angeles Time) | 0.4 mi (0.6 km) NE from Main Shock. |
| Aftershock | M 3.6 |
3 mins later Nov 26, 2025 06:20AM (Los Angeles Time) | 0.3 mi (0.5 km) ENE from Main Shock. |
| Aftershock | M 2.7 |
1 day later Nov 27, 2025 12:10PM (Los Angeles Time) | 14 mi (23 km) SSW from Main Shock. |
| Aftershock | M 3.7 |
1 day later Nov 27, 2025 12:48PM (Los Angeles Time) | 14 mi (23 km) SSW from Main Shock. |
| Aftershock | M 4.0 |
1 day later Nov 27, 2025 12:57PM (Los Angeles Time) | 14 mi (23 km) SSW from Main Shock. |
| Aftershock | M 3.2 |
2 days later Nov 28, 2025 07:40AM (Los Angeles Time) | 12 mi (20 km) SSW from Main Shock. |
| Aftershock | M 2.5 |
2 days later Nov 28, 2025 07:40AM (Los Angeles Time) | 12 mi (20 km) SSW from Main Shock. |
| Aftershock | M 2.5 |
2 days later Nov 28, 2025 07:42AM (Los Angeles Time) | 12 mi (20 km) SSW from Main Shock. |
| Aftershock | M 2.8 |
3 days later Nov 28, 2025 11:47PM (Los Angeles Time) | 12 mi (20 km) SSW from Main Shock. |
More earthquakes coming?
Aftershocks are usually at least 1 order of magnitude less strong than main shocks. The more time passes, the smaller the chance and likely strength of any potential aftershocks.
It's always adviced to be cautious of the risk of a larger shock following any significant earthquake, however this risk is fairly small. There is a roughly 94 percent change that no larger main shock will follow in the days following this earthquake.
Read: How to Stay Safe during an Earthquake (cdc.gov).Earthquakes like this happen often in the region
Earthquakes of this strength are very common in the region. This is the strongest earthquake to hit since November 18th, 2025, when a 4.1 magnitude earthquake hit 107 mi (172 km) further south-southeast. An even stronger magnitude 6 earthquake struck on July 8th, 2021.
In total, 106 earthquakes with a magnitude of 4 or higher have been registered within 300km (186 mi) of this epicenter in the past 10 years. This comes down to an average of once every month.
Sources
Last updated 25/01/26 05:48 (). As more information on this earthquake becomes available this article will be updated. This article is automatically composed based on data originating from multiple sources.
- US Geographic Society (USGS): Earthquake nc75269596
- European-Mediterranean Seismological Centre (EMSC): Earthquake 20251126_0000204
- Geonames.org: World Cities Database
- Google Maps: Static API
- Earthquakelist.org: Historic Earthquakes Database
Share this article:
