Latest earthquakes near The United States today
Complete overview of the latest earthquakes near the country The United States, updated every minute. Did you feel an earthquake today in The United States? If an earthquake is happening right now near The United States (also known as U.S.A.), it will show up within minutes.
Recent The United States Earthquake News
These are the latest articles published related to earthquakes occurring near The United States. Check our Earthquake News section for a complete overview of articles written on earthquakes near The United States and elsewhere.
 Feb 10, 2026 11:42AM
M4.6 Earthquake hit near Anchorage in The United States on Tuesday Morning.
Feb 10, 2026 11:42AM
M4.6 Earthquake hit near Anchorage in The United States on Tuesday Morning.
 Feb 5, 2026 04:49AM
On Thursday Night a Shallow M4.7 Earthquake struck in the North Pacific Ocean 77mi from Eureka (The United States).
Feb 5, 2026 04:49AM
On Thursday Night a Shallow M4.7 Earthquake struck in the North Pacific Ocean 77mi from Eureka (The United States).
 Feb 2, 2026 07:01AM
Shallow M4.2 Earthquake hit near San Ramon in The United States on Monday Morning.
Feb 2, 2026 07:01AM
Shallow M4.2 Earthquake hit near San Ramon in The United States on Monday Morning.
 Jan 29, 2026 12:41PM
Shallow M4.2 Earthquake struck on Thursday Afternoon near Great Falls in The United States.
Jan 29, 2026 12:41PM
Shallow M4.2 Earthquake struck on Thursday Afternoon near Great Falls in The United States.
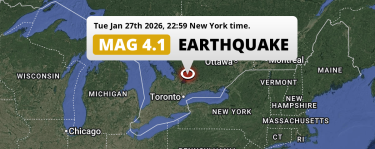 Jan 27, 2026 10:59PM
Unusually powerful M4.1 Earthquake struck on Tuesday Evening near Toronto in Canada.
Jan 27, 2026 10:59PM
Unusually powerful M4.1 Earthquake struck on Tuesday Evening near Toronto in Canada.
 Jan 26, 2026 11:37PM
M4.2 Earthquake struck on Monday Evening near Hilo in The United States.
Jan 26, 2026 11:37PM
M4.2 Earthquake struck on Monday Evening near Hilo in The United States.
The United States Earthquake Statistics
Average
A total of 1737 earthquakes with a magnitude of four or above have struck within 186 mi (300 km) of The United States in the past 10 years. This comes down to a yearly average of 173 earthquakes per year, or 14 per month. On average an earthquake will hit near The United States roughly every 2 days.
A relatively large number of earthquakes occurred near The United States in 2018. A total of 245 earthquakes (mag 4+) were detected within 186 mi of The United States that year. The strongest had a 7.1 magnitude.

Magnitude Distribution
The table below visualizes the distribution of all earthquakes that occurred within 300km of The United States in the past 10 years. No earthquakes with a magnitude of 8 or above have occurred near The United States during this time. Usually, higher magnitudes are less common than lower magnitudes. Small earthquakes with a magnitude below 4 on the Richter scale have been omitted from this overview.
| Magnitude | Earthquakes | Percentage |
|---|---|---|
| Mag. 4 | 1536 | 88.43% |
| Mag. 5 | 184 | 10.59% |
| Mag. 6 | 14 | 0.81% |
| Mag. 7 | 3 | 0.17% |
| Mag. 8 | 0 | 0.0% |
| Mag. 9 | 0 | 0.0% |
| Mag. 10 | 0 | 0.0% |
Strongest earthquakes near The United States
The strongest recent earthquake of the past 10 years near The United States occurred on Jul 5, 2019 20:19 local time (America/Los_Angeles timezone). It had a magnitude of 7.1 and struck 124 miles (200 km) north-northeast of Los Angeles, at a depth of 5 mi . Discover more strong earthquakes near The United States in the list below.
A longer time ago, a MAG-9.2 earthquake struck on Mar 27, 1964 17:36, 88 miles (142 km) north-northeast of Anchorage. It is the strongest earthquake near The United States in the past 126 years (Our data goes back to January 1st, 1900).
In the table below you will find the strongest earthquakes that occurred near The United States in the past 10 years. You can use the tabs to find the heaviest historic earthquakes since the year 1900 or within a specific year or distance from The United States.
Earthquakes by region of The United States
Click the links below for earthquake reports for regions in The United States.
- Alabama
- Alaska
- Arizona
- Arkansas
- California
- Colorado
- Connecticut
- Delaware
- Florida
- Georgia
- Hawaii
- Idaho
- Illinois
- Indiana
- Iowa
- Kansas
- Kentucky
- Louisiana
- Maine
- Maryland
- Massachusetts
- Michigan
- Minnesota
- Mississippi
- Missouri
- Montana
- Nebraska
- Nevada
- New Hampshire
- New Jersey
- New Mexico
- New York
- North Carolina
- North Dakota
- Ohio
- Oklahoma
- Oregon
- Pennsylvania
- Rhode Island
- South Carolina
- South Dakota
- Tennessee
- Texas
- Utah
- Vermont
- Virginia
- Washington
- Washington, D.C.
- West Virginia
- Wisconsin
- Wyoming
Frequently Asked Questions
These questions are commonly asked in relation to earthquakes occurring near The United States.
When was the last earthquake in The United States?
A 2.3 magnitude earthquake hit near The United States on the afternoon of February 18, 2026 at 14:15 local time (America/Los_Angeles). The center of this earthquake was located 254km east-southeast of Reno at a depth of 5km under land. Check the list on our website for any earthquakes occurring near The United States in the past hours.
What was the strongest earthquake near The United States?
A 9.2 magnitude earthquake hit near The United States on the afternoon of March 27, 1964 at 17:36 local time (America/Anchorage). The center of this earthquake was located 142km east-southeast of Anchorage at a depth of 25km under land. This is the strongest earthquake that occurred near The United States since the year 1900.
How often do earthquakes occur near The United States?
In the past 10 years, 1737 earthquakes with a magnitude of four or higher occurred within a 300 kilometer range from The United States. This averages to 174 earthquakes yearly, or one earthquake every 2 days.
